Analyzing native memory allocation with BenchmarkDotNet
The NativeMemoryProfiler is a new diagnoser for BenchmarkDotNet that I implemented in version 0.12.0. In this post, you will learn how to analyze native memory allocations in your code. It sounds like a difficult topic, but trust me, you can do it really easily with BenchmarkDotNet.
The story
Not so long ago, I got a task that was difficult for me. To be honest, I did not know where to start. I like this kind of tasks because they are a challenge and a good opportunity to learn something new. I had to create an application to validate native DLLs that were created by other companies. This application should call all functions, check how long it takes to execute all functions and check if functions do not allocate native memory. The last thing was the hardest for me.
I thought I would find a solution in some open source project. I started from BenchmarkDotNet which is my favorite .NET library for benchmarking. To my surprise, it turned out that BenchmarkDotNet did not support tracking native allocations. I even found an issue dotnet/BenchmarkDotNet#457 that had labels: help wanted and up-for-grabs. Luckily in this issue, I found information that @kayle added support for tracking type of native memory allocations in PerfView. Here is his PR microsoft/perfview#857. Thanks to it, I had all information to solve my problem but also I was able to make NativeMemoryProfiler for BenchmarkDotNet. So I did it.
Demo
Bellow is a sample benchmark which uses the Marshal.AllocHGlobal and Marshal.FreeHGlobal methods to allocate and free native memory.
[ShortRunJob]
[NativeMemoryProfiler] // <-- This attribute enables the profiler for native allocation.
[MemoryDiagnoser]
public class IntroNativeMemory
{
    private const int Size = 20; // Greater value could cause System.OutOfMemoryException for a test with memory leaks.
    private int ArraySize = Size * Marshal.SizeOf(typeof(int));

    [Benchmark]
    public unsafe void AllocHGlobal()
    {
        IntPtr unmanagedHandle = Marshal.AllocHGlobal(ArraySize);
        Span<byte> unmanaged = new Span<byte>(unmanagedHandle.ToPointer(), ArraySize);
        Marshal.FreeHGlobal(unmanagedHandle);
    }

    [Benchmark]
    public unsafe void AllocHGlobalWithLeaks()
    {
        IntPtr unmanagedHandle = Marshal.AllocHGlobal(ArraySize);
        Span<byte> unmanaged = new Span<byte>(unmanagedHandle.ToPointer(), ArraySize);
    }
}
As you can see, all you have to do to enable the profiler for native allocations is to add the NativeMemoryProfiler attribute to your benchmark.
If you use ManualConfig you can add this profiler this way:
private class Config : ManualConfig
{
    public Config()
    {
        Add(new NativeMemoryProfiler()); // <-- adding profiler for native allocation
        //Your configuration
    }
}
If you don’t want to use this profiler every time, you can also enable it from the command line using -p NativeMemory or --profiler NativeMemory parameter. This allows you to enable the NativeMemoryProfiler on demand.
# for .Net Framework application:
NativeMemorySample.exe --profiler NativeMemory
# for .Net Core application:
dotnet NativeMemorySample.dll --profiler NativeMemory
# or run benchmark from the directory where is your csproj:
dotnet run -c Release -f netcoreapp2.1 -- --filter *IntroNativeMemory.Alloc* --profiler NativeMemory
After running the above example code, you will see the results:
| Method | Mean | Error | StdDev | Gen 0 | Gen 1 | Gen 2 | Allocated | Allocated native memory | Native memory leak |
|---|---|---|---|---|---|---|---|---|---|
| AllocHGlobal | 78.60 ns | 10.55 ns | 0.578 ns | - | - | - | - | 80 B | - |
| AllocHGlobal WithLeaks | 101.17 ns | 150.67 ns | 8.259 ns | - | - | - | - | 80 B | 80 B |
As you can see, NativeMemoryProfiler adds extra columns: “Allocated native memory” and “Native memory leak”, to the summary table. In output, you can also find additional information from this diagnoser. This log contains useful information, e.g.: the location of the exported *.etl files or the number of allocated and not deallocated objects.
// * Diagnostic Output - NativeMemoryProfiler *
Exported 2 trace file(s). Example:
C:\Work\NativeMemorySample\NativeMemorySample\BenchmarkDotNet.Artifacts\NativeMemorySample.IntroNativeMemory.AllocHGlobal-20190806-115958.etl

--------------------
IntroNativeMemory.AllocHGlobal: ShortRun(IterationCount=3, LaunchCount=1, WarmupCount=3)
--------------------
Native memory allocated per single operation: 80 B

--------------------
IntroNativeMemory.AllocHGlobalWithLeaks: ShortRun(IterationCount=3, LaunchCount=1, WarmupCount=3)
--------------------
Native memory allocated per single operation: 80 B
Native memory leak per single operation: 80 B
Count of not deallocated object: 1

// * Diagnostic Output - MemoryDiagnoser *
The tracking type of native memory allocation
Currently, BenchmarkDotNet does not print information about native memory allocation types, but NativeMemoryProfiler saves this information in *.etl files. As I mentioned earlier, thanks to @kayle and his great PR microsoft/perfview#857, you can easily get type names using PerfView.
If the benchmark uses your native DLL, you can check what types were used. Here is an example C++ code of a native DLL:
typedef struct _Point {
	int X;
	int Y;
}Point;

__declspec(dllexport) Point* AllocateArrayOfPoint(int size)
{
	Point* a = new Point[size];

	// Initialize all elements.
	for (int i = 0; i < size; i++) {
		a[i].X = i;
		a[i].Y = i + 1;
	}
	return a;
}

__declspec(dllexport) void DeallocateArrayOfPoint(Point* ptr)
{
	delete[] ptr;
}
TheAllocateArrayOfPoint method allocates an array of Point and DeallocateArrayOfPoint deletes this array.
In C#, you need to create a wrapper for this DLL:
[StructLayout(LayoutKind.Sequential)]
public struct Point
{
    public int X;
    public int Y;
}

public class NativeDll
{
    [DllImport("NativeDll.dll")]
    public static extern IntPtr AllocateArrayOfPoint(int count);

    [DllImport("NativeDll.dll")]
    public static extern void DeallocateArrayOfPoint(IntPtr ptr);
}
Your benchmark can look like this:
[ShortRunJob]
[NativeMemoryProfiler]
public class IntroNativeMemoryFromNativeDll
{
    [Benchmark]
    public int AllocAndFreeNativeStruct()
    {
        var ptr = NativeDll.AllocateArrayOfPoint(200);
        var result = 0;
        unsafe
        {
            var bytes = new Span<Point>((Point*)ptr, 200);
            foreach (var item in bytes)
            {
                result += item.X + item.Y;
            }
        }
        NativeDll.DeallocateArrayOfPoint(ptr);
        return result;
    }
}
You can run this benchmark from the command line using the following command:
dotnet run -c Release -f netcoreapp2.1 -- --filter *AllocAndFreeNativeStruct*In output you can see the summary table:
| Method | Mean | Error | StdDev | Allocated native memory | Native memory leak |
|---|---|---|---|---|---|
| AllocAndFreeNativeStruct | 323.0 ns | 66.38 ns | 3.64 ns | 1600 B | - |
This benchmark uses 1600 B of native memory because Point has two filed int X and int Y, int has 4 B and in this benchmark there was an array with 200 elements allocated. (2 * 4B * 200 = 1600 B)
Now it’s time to use the PerfView.
The first step is to open the etl file in PerfView and navigate to the Events window.
Because BenchmarkDotNet runs your benchmarked function many times in one workload and it runs many workloads, we would like to narrow down the search. For example, the above test on my computer generates the following result log which means that my benchmarked function was running 131072 times in one workload. And we know that there were tree workloads.
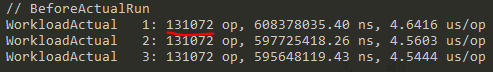
Firstly, you need to find the start and end times of the first WarkloadActual. When you have these times, you can find all HeapTrace events. In summary, you can find information about how many objects were allocated:
Native memory allocated per single operation: 1600 B
Count of allocated object: 1
In my example, there was only one object which means that the first event HeapTraceProvider/HeapTrace/Alloc came from the first run of my benchmarked function, from the first workload. The following image shows how to find this information in PerfView:

Now it is time to show the information regarding types. In PerfView you should open Net OS Heap Alloc Stacks window from Memory Group. You can use the start and end times of the first Workload because only data between these times is interesting. Below you can see, how to show the information about on types of allocated objects.

How it works
To implement NativeMemoryProfiler I used EtwProfiler that runs User, Kernel, and Heap ETW sessions. Each session writes data to its own file and in the end these files are marge to one *.etl file. The NativeMemoryProfiler uses different events from different sessions:
- BenchmarkDotNet Engine events, like
WorkloadActualStartandWorkloadActualStopfrom User session, - HeapTrace events, like
HeapTraceAlloc,HeapTraceFree,HeapTraceReAlloc,HeapTraceDestroy, from Heap session.
You can find the source code in my PRs: #1131 and #1208 or directly in the BenchmarkDotNet code.
Limitations
Because NativeMemoryProfiler uses EtwProfiler, it also has its limitations:
- Windows only
- Requires running as Admin (ETW Kernel Session)
- No
InProcessToolchainsupport
Summary
In advanced projects, native code and resources are used very often. Currently, during benchmarking your code, not only you can easily check its speed, but also check how much native memory it uses, thanks to NativeMemoryProfiler.