Cross-platform profiling .NET code with BenchmarkDotNet
EventPipeProfiler is a new cross-platform profiler that I’ve implemented in the BenchmarkDotNet library. It allows profile .NET code on every platform - Windows, Linux, macOS. Collected data are exported to trace files (.speedscope.json and .nettrace) which can be analyzed using SpeedScope, PerfView, and Visual Studio Profiler. This new profiler will be available from 0.12.1 version.
Demo
This profiler can be used in a really simple way. All that needs to be done is mark a benchmarked class with the [EventPipeProfiler(...)] attribute.
using System.Threading;
using BenchmarkDotNet.Attributes;
using BenchmarkDotNet.Diagnosers;

namespace BenchmarkDotNet.Samples
{
    [EventPipeProfiler(EventPipeProfile.CpuSampling)] // <-- Enables new profiler
    public class IntroEventPipeProfiler
    {
        [Benchmark]
        public void Sleep() => Thread.Sleep(2000);
    }
}
The above benchmark generates the output:
[...]
// * Summary *
[...]
| Method | Mean | Error | StdDev |
|------- |--------:|---------:|---------:|
| Sleep | 2.001 s | 0.0059 s | 0.0003 s |
// * Legends *
[...]
// * Diagnostic Output - EventPipeProfiler *
Exported 1 trace file(s). Example:
C:\work\BenchmarkDotNet\samples\BenchmarkDotNet.Samples\BenchmarkDotNet.Artifacts\BenchmarkDotNet.Samples.IntroEventPipeProfiler.Sleep-20200403-234150.speedscope.json
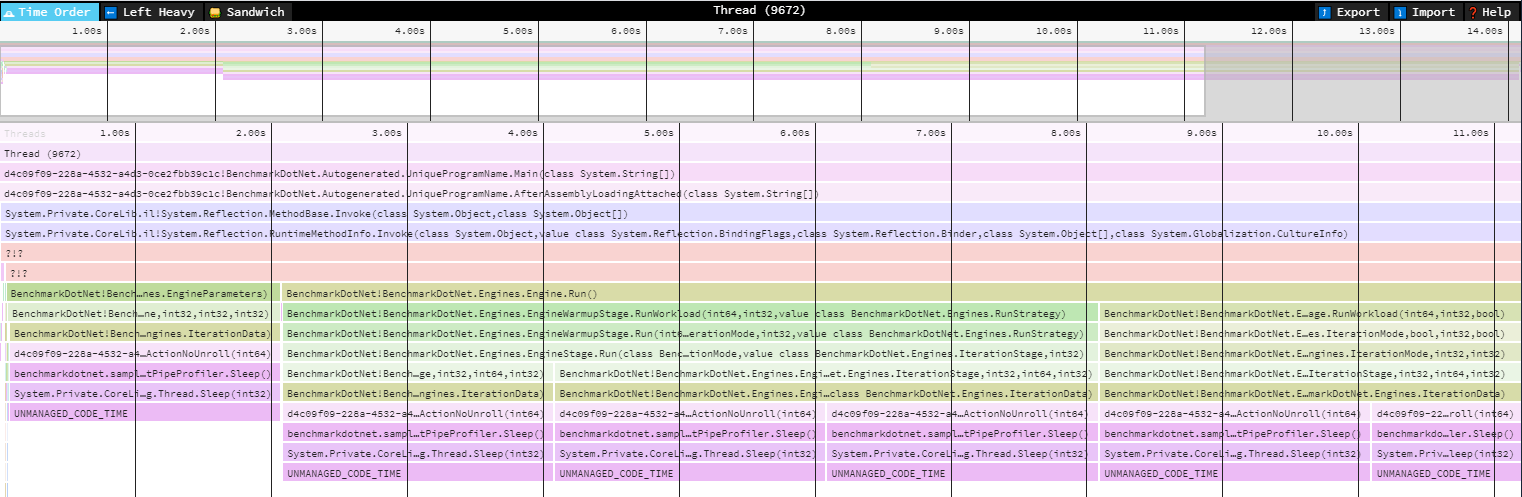
// ***** BenchmarkRunner: End *****And the exported .speedscope.json file can be opened in SpeedScope.
The story
EtwProfiler profiler is very popular but works only on Windows. .NET Core 3.0 shipped a new cool diagnostics features and tools, so it became possible to create a new cross-platform profiler.
On the Dotnetos Conference 2019, Adam Sitnik showed the new dotnet trace tool on his .NET Performance Investigation presentation. During a break, I asked Adam why not use it in BenchmarkDotNet? My first idea was to use dotnet trace command directly in the profiler, but it was not possible because of an issue. The second option was using Microsoft.Diagnostics.NETCore.Client nuget package which allows everyone to create a profiler in no time. There was only one problem, this package was published in the preview version and I could not able to use it in BenchmarkDotNet. Luckily Sung Yoon Whang came with help and released a final version right away.
All implementation details can be seen in my PR dotnet/BenchmarkDotNet#1321.
Configuration
EventPipeProfiler can be configured in three different way:
Attribute - As you can see above you can use the
[EventPipeProfiler(...)]attribute. This attribute takes the following profiles:CpuSampling- Useful for tracking CPU usage and general .NET runtime information. This is the default option.GcVerbose- Tracks GC collections and samples object allocations.GcCollect- Tracks GC collections only at very low overhead.Jit- Logging when Just in time (JIT) compilation occurs. Logging of the internal workings of the Just In Time compiler. This is fairly verbose. It details decisions about interesting optimization (like inlining and tail call)
Console line parameter - The parameter
-p EPor--profiler EPcan be used to enable this profiler from the console line.Custom config - The most advanced and powerful way is to use a custom configuration.
The first thing which should be done is the configuration class. The EventPipeProfiler constructor can take the profile and/or a list of providers.
    private class CustomConfig : ManualConfig
    {
        public CustomConfig()
        {
            AddJob(Job.ShortRun.WithRuntime(CoreRuntime.Core30));

            var providers = new[] // <-- custom list of providers
            {
                new EventPipeProvider(ClrTraceEventParser.ProviderName, EventLevel.Verbose,
                    (long) (ClrTraceEventParser.Keywords.Exception
                    | ClrTraceEventParser.Keywords.GC
                    | ClrTraceEventParser.Keywords.Jit
                    | ClrTraceEventParser.Keywords.JitTracing // for the inlining events
                    | ClrTraceEventParser.Keywords.Loader
                    | ClrTraceEventParser.Keywords.NGen)),
                new EventPipeProvider("System.Buffers.ArrayPoolEventSource", EventLevel.Informational, long.MaxValue),
            };

            AddDiagnoser(new EventPipeProfiler(providers: providers));  //<-- Adds new profiler
        }
    }
Then this configuration can be used in the benchmark class.
namespace BenchmarkDotNet.Samples
{
    [Config(typeof(CustomConfig))]
    public class IntroEventPipeProfilerAdvanced
    {
        private class CustomConfig : ManualConfig {} // <-- Configuration class

        [Benchmark]
        public void RentAndReturn_Shared()
        {
            var pool = ArrayPool<byte>.Shared;
            byte[] array = pool.Rent(10000);
            pool.Return(array);
        }
    }
}
As I mentioned before, both EventPipeProfiler and dotnet trace use the Microsoft.Diagnostics.NETCore.Client package internally. So before you start using the custom configuration of this profiler, it is worth reading the documentation here and here.
Analyzing trace files using PerfView
This topic is completely described on Adam Sitnik’s blog, here, so I’m not going to duplicate that information here.
Thanks
I would like to thank:
- Adam Sitnik - for the review and the farther improvement in this profiler, I mean dotnet/BenchmarkDotNet#1381
- Sung Yoon Whang - for great work in Microsoft.Diagnostics.NETCore.Client nuget package, especially for quick release the final version of this package.
- Dotnetos Conference - without which I could not have started work at all.